Tuesday, December 22, 2015

The Role of 2,3-Diphophoglycerate


The Role of 2,3-Diphophoglycerate

     The major function of the hemoglobin molecule is the transport of oxygen to the tissues. The oxygen affinity of the hemoglobin molecule is associated with the spatial rearrangement of the molecule and is regulated by the concentration of phosphates, particularly 2,3-DPG in the erythrocyte. The manner in which 2,3-DPG binding to reduced hemoglobin (deoxyhemoglobin) affects oxygen affinity is complex. Basically, 2,3-DPG combines with the beta chains of deoxyhemoglobin and diminishes the molecule’s affinity for oxygen. 


    When the individual heme groups unload oxygen in the tissues, the beta chains are pulled apart. This permits the entrance of 2,3-DPG and the establishment of salt bridges between the individual chains. These activities result in a progressively lower affinity of the molecule for oxygen. With oxygen uptake in the lungs, the salt bonds are sequentially broken; the beta chains are pulled together, expelling 2,3-DPG; and the affinity of the hemoglobin molecule for oxygen progressively increases.
     In cases of tissue hypoxia, oxygen moves from hemoglobin into the tissues, and the amount of deoxyhemoglobin in the erythrocytes increases. This produces the binding of more 2,3-DPG, which further reduces the oxygen affinity of the hemoglobin molecule. If hypoxia persists, depletion of free 2,3-DPG leads to increased production of more 2,3-DPG and a persistently lowered affinity of the hemoglobin molecule for oxygen.


Figure: Hemoglobin molecular changes


Friday, December 11, 2015

Alterations in Myeloid:Erythroid Ratio


     The M:E ratio is sensitive to hematologic factors that may impair red blood cell life span, inhibit overall production, or cause dramatic increases in a particular cell line. Each of these conditions reflects bone marrow dynamics through alterations of the M:E ratio. Many observations in the peripheral smear can be traced back to the pathophysiologic events at the level of bone marrow. A perfect example of this is the response of the bone marrow to anemia. As anemia develops and becomes more severe, the patient becomes symptomatic, and the kidney senses hypoxia secondary to a decreased hemoglobin level. Tissue hypoxia stimulates an increased release of erythropoietin (EPO), a red blood cell-stimulating hormone, from the kidney. EPO travels through the circulation and binds with a receptor on the youngest of bone marrow precursor cells, the pronormoblast. Bone marrow has the capacity to expand production 6-8 times in response to an anemic event. Consequently, the bone marrow delivers reticulocytes and nucleated red blood cells to the peripheral circulation prematurely if the kidney senses hypoxic stress. What is observed in the peripheral blood smear is polychromasia (stress reticulocytes, large polychromatophilic red blood cells) and nucleated red blood cells. Both of these cell types indicate that the bone marrow is regenerating in response to an event, a dynamic that represents the harmony between bone marrow and peripheral circulation.


Bone Marrow & Myeloid:Erythroid Ratio


     The bone marrow is one of the largest organs of the body, encompassing 3% to 6% of body weight and weighing 1500 g in an adult. It is hard to conceptualize the bone marrow as an organ because it is not a solid organ that one can touch, measure, or weigh easily. Because bone marrow tissue is spread throughout the body, one can visualize it only in that context. It is
composed of yellow marrow, red marrow, and an intricate supply of nutrients and blood vessels. Within this structure are erythroid cells (red blood cells), myeloid cells (white blood cells), and megakaryocytes (platelets) in various stages of maturation, along with osteoclasts, stroma, and fatty tissue. Mature cells enter the peripheral circulation via the bone marrow sinuses, a central structure lined with endothelial cells that provide passage for mature cells from extravascular sites to the circulation. The cause and effect of hematologic disease are usually rooted in the bone marrow, the central factory for production of all adult hematopoietic cells. In the first 18 years of life, bone marrow is spread throughout all of the major bones of the skeleton, especially the long bones. As the body develops, the marrow is gradually replaced by fat until the prime locations for bone marrow in an adult become the iliac crest (located in the pelvic area) and the sternum (located in the chest area).
     In terms of cellularity, there is a unique ratio in the bone marrow termed the myeloid:erythroid (M:E) ratio. This numerical designation provides an approximation of the myeloid elements in the marrow and their precursor cells and the erythroid elements in the marrow and their precursor cells. The normal ratio of 3:1 to 4:1 reflects the relationship between production and life span of the various cell types. White blood cells have a much shorter life span than red blood cells (6 to 10 hours for neutrophils as opposed to 120 days for erythrocytes) and must be produced at a much higher rate for normal hematopoiesis.


Thursday, December 10, 2015

Iron Distribution


Iron-containing compounds in the body are one of two types:
  1. Functional compounds that serve in metabolic (hemoglobin, myoglobin, iron-responsive element-binding protein) or enzymatic (cytochromes, cytochrome oxygenase, catalase, peroxidase) functions
  2. Compounds that serve as transport (transferrin, transferrin receptor) or storage forms (ferritin and hemosiderin) for iron. 
     A poorly understood iron compartment is the intracellular “labile pool.” Iron leaves the plasma and enters the intracellular fluid compartment for a brief time before it is incorporated into cellular components (heme or enzymes) or storage compounds. This labile pool is believed to be the chelatable iron pool. The total iron concentration in the body is 40–50 mg of iron/kg of body weight. Men have higher amounts than women.

    Iron is found primarily in erythrocytes, macrophages, hepatocytes, and enterocytes (absorptive cells at the luminal [apical] surface of the duodenum). Hemoglobin constitutes the major fraction of body iron (functional iron) with a concentration of 1 gm iron/kg of erythrocytes, or about 1 mg iron/mL erythrocytes. Iron in hemoglobin remains in the erythrocyte until the cell is removed from the circulation. Hemoglobin released from the erythrocyte is then degraded in the macrophages of the spleen and liver, releasing iron. Approximately 85% of this iron from degraded hemoglobin is promptly recycled from the macrophage to the plasma where it is bound to the transport protein, transferrin, and delivered to developing normoblasts in the bone marrow for heme synthesis. The macrophages recycle 10 to 20 times more iron than is absorbed in the gut. This iron recycling provides most of the marrow’s daily iron requirement for erythropoiesis.

      Iron in hepatocytes and intestinal enterocytes is stored and utilized as needed to maintain iron homeostasis. The hepatocytes store iron that can be released and utilized when the amount of iron in the plasma is not sufficient to support erythropoiesis. Enterocytes that absorb dietary iron can either export it to the plasma or store it. Iron stored in enterocytes is lost when the cells are sloughed into the intestine. 


Monday, December 7, 2015

Erythrocyte


Erythrocyte (Mature Erythrocyte)


  • Bone marrow : 0 %
  • Peripheral blood : Predominant cell type
  • Size : 7-8 μm
  • No nucleus
  • No nucleoli
  • No chromatin 
  • No N/C ratio 
  • Cytoplasm: Salmon with central pallor of about one-third of the diameter of the cell


NOTE: The mature erythrocyte has lost the blue-gray color and is salmon colored as hemoglobinization is complete. 


Friday, December 4, 2015

Multiple Myeloma


     Multiple myeloma (myelomatosis) is a neoplastic disease characterized by plasma cell  accumulation in the bone marrow, the presence of monoclonal protein in the serum and/or urine and, in symptomatic patients, related tissue damage.


Reticulocyte


Reticulocyte ( Polychromatic Erythrocyte / Diffusely Basophilic Erythrocyte )


  • Size = 7-10 μm
  • No nucleus (so there is no N/C ratio)
  • No nucleoli
  • No chromatin
  • Cytoplasm: Color is slightly more blue/purple than the mature erythrocyte because there are RNA remnants.
  • Bone marrow: 1 %
  • Peripheral blood: 0.5 - 2.0 % 

NOTE:  When stained with supravital stain (e.g., new methylene blue), polychromatic erythrocytes appear as reticulocytes (contain precipitated ribosomal material)


Thursday, December 3, 2015

Orthochromic Normoblast


Orthochromic Normoblast ( Orthochromic Erythroblast / Metarubricyte )


  • 1 - 4% of nucleated cells in BM
  • Peripheral blood: 0 %
  • Size = 10 -15 μm
  • Low N/C ratio (1:2)
  • Round nucleus
  • No nucleoli
  • Fully condensed chromatin 
  • Cytoplasm: more pink or salmon than blue 


NOTE: The gray-blue color of the cytoplasm is becoming salmon as more hemoglobin is produced. 


Wednesday, December 2, 2015

Polychromatophilic Normoblast


Polychromatophilic Normoblast ( Polychromatic Normoblast / Polychromatic Erythroblast / Rubricyte )


  • 13-30% of nucleated cells in BM.
  • Peripheral Blood : 0 % 
  • Size = 12 - 15 μm
  • Low N/C ratio (4:1)
  • Eccentric nucleus
  • No nucleoli 
  • Chromatin irregular and coarsely clumped
  • Cytoplasm: Gray-blue as a result of hemoglobinization 

NOTE: The blue color of the cytoplasm is becoming gray-blue as hemoglobin is produced


Tuesday, December 1, 2015

Basophilic Normoblast


Basophilic Normoblast (Basophilic Erythroblast / Prorubricyte)


  • 1-3% of nucleated cells in BM.
  • Peripheral blood : 0 %
  • Size = 16-18 μm
  • Round to slightly oval nucleus
  • Moderate N/C ratio (6:1) 
  • Dark blue cytoplasm
  • Indistinct nucleoli ( 0 - 1 nucleoli
  • Coarsening ( slightly condensed ) chromatin


Pronormoblast


Pronormoblast (also known as Proerythroblast / Rubriblast) is the first microscopically recognizable cell in erythrocyte lineage.


  • 1% of Nucleated Cells in BM.
  • Peripheral Blood: 0%
  • 1% of Nucleated Cells in BM.
  • Size: 20-25 μm
  • Nucleus: Round to slightly oval
  • High N/C ratio (8:1)
  • 1-3 faint nucleoli 
  • Fine chromatin
  • Cytoplasm: Dark blue; may have prominent Golgi


Glycosylated Hemoglobin


     HbA1C on chromatography is a minor component of normal adult hemoglobin (HbA) that has been modified posttranslationally (HbA3 on starch block electrophoresis). A component usually has been added to the N terminus of the β-chain. The most important subgroup of HbA1 is HbA1C , which has glucose irreversibly attached. This hemoglobin is referred to as glycosylated hemoglobin. HbA1C is produced throughout the erythrocyte’s life, its synthesis dependent on the concentration of blood glucose. Older erythrocytes typically contain more HbA1C than younger erythrocytes having been exposed to plasma glucose for a longer period of time. However, if young cells are exposed to extremely high concentrations of glucose ( >400 mg/dL)  for several hours, the concentration of HbA1C increases with both concentration and time of exposure.
     Measurement of is routinely used as an indicator of control of blood glucose levels in diabetics because it is proportional to the average blood glucose level over the previous two to three months. 
     Average levels of HbA1C are 7.5% in diabetics and 3.5% in normal individuals.


Structure of Hemoglobin


     Hemoglobin is the life-giving substance of every red blood cell, the oxygen-carrying component of the red blood cell. Each red blood cell is nothing more than a fluid-filled sac, with the fluid being hemoglobin. Every organ in the human body depends on oxygenation for growth and function, and this process is ultimately controlled by hemoglobin. In 4 months (120 days), red blood cells with normal hemoglobin content submit to the rigors of circulation. Red blood cells are stretched, twisted, pummeled, and squeezed as they make their way through the circulatory watershed.
The hemoglobin molecule consists of two primary structures:

1- Heme
This structure involves four iron atoms in the ferrous state (Fe2+ ), because iron in the ferric state (Fe3+ ) cannot bind oxygen, surrounded by protoporphyrin IX, or the porphyrin ring, a structure formed in the nucleated red blood cells. Protoporphyrin IX is the final product in the synthesis of the heme molecule. It results from the interaction of succinyl coenzyme A and delta-aminolevulinic acid in the mitochondria of the nucleated red blood cells. Several intermediate by-products are formed, including porphobilinogen, uroporphyrinogen, and coproporphyrin. When iron is incorporated, it combines with protoporphyrin to form the complete heme molecule. Defects in any of the intermediate products can impair hemoglobin function.
2- Globin
This structure consists of amino acids linked together to form a polypeptide chain, a bracelet of amino acids. The most predominant chains for adult hemoglobins are the alpha and beta chains. Alpha chains have 141 amino acids in a unique arrangement, and beta chains have 146 amino acids in a unique arrangement. The heme and globin portions of the hemoglobin molecule are linked together by chemical bonds.
2,3-Diphosphoglycerate (2,3-DPG)
2,3-DPG is a substance produced via the Embden-Meyerhof pathway during anaerobic glycolysis. This structure is intimately related to oxygen affinity of hemoglobin. As 2,3-DPG increased, the affinity of hemoglobin to oxygen is decreased. 

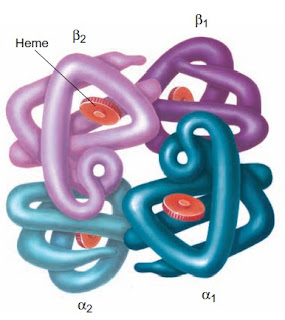
     Each hemoglobin molecule consists of four heme molecules with iron at the center and two pairs of globin chains. The heme structure sits lodged in the pocket of the globin chains. Hemoglobin begins to be synthesized at the polychromatic normoblast stage of red blood cell development. This synthesis is visualized by the change in cytoplasmic color from a deep blue to a lavender-tinged cytoplasmic color. Of hemoglobin, 65% is synthesized before the red blood cell nucleus is extruded, with an additional 35% synthesized by the reticulocyte stage. Normal mature red blood cells have a full complement of hemoglobin, which occupies a little less than one-half of the surface area of the red blood cell.


Figure: Hemoglobin molecule: note four heme molecules tucked inside globin chains. 


Saturday, November 28, 2015

Morphologic Characteristics of Erythroid Precursors


Pronormoblast (rubriblast):


  • 1% of Nucleated Cells in BM.
  • Size = 20-25 μm.
  • High N/C ratio (8:1)
  • 1-3 faint nucleoli 
  • Lacy chromatin 


Basophilic normoblast (prorubricyte):


  • 1-3% of nucleated cells in BM.
  • Size = 16-18 μm
  • Moderate N/C ratio (6:1)
  • Indistinct nucleoli
  • coarsening chromatin


Polychromatophilic normoblast (rubricyte):


  • 13-30% of nucleated cells in BM.
  •  Size = 12 - 15 μm
  • Low N/C ratio (4:1)
  • Chromatin irregular and coarsely clumped
  • Eccentric nucleus


Orthochromic normoblast (metarubricyte):


  • 1-4% of nucleated cells in BM
  • Size = 10 -15 μm
  • Low N/C ratio (1:2)


Reticulocyte (new methylene blue stain):


  • Size = 7-10 μm
  • No N/C ratio because there is no nucleus


Reticulocyte (Wright’s stain):

  • Polychromatophilic (diffusely basophilic)


Mature RBC:


  • Size = 7 -8 μm
  • No nucleus

Thymus


      The thymus is a lymphopoietic organ located in the upper part of the anterior mediastinum. It is a bilobular organ demarcated into an outer cortex and central medulla. The cortex is densely packed with small lymphocytes (thymocytes), cortical epithelial cells, and a few macrophages. The medulla is less cellular and contains more mature thymocytes mixed with medullary epithelial cells, dendritic cells, and macrophages. The primary purpose of the thymus is to serve as a compartment for maturation of T lymphocytes. Precursor T cells leave the bone marrow and enter the thymus through arterioles in the cortex. As they travel through the cortex and the medulla, they interact with epithelial cells and dendritic cells, which provide signals to ensure that T cells can recognize foreign antigen but not self-antigen. They also undergo rapid proliferation. Only about 3% of the cells generated in the thymus exit the medulla as mature T cells. The rest die by apoptosis and are removed by thymic macrophages. The thymus is responsible for supplying the T-dependent areas of lymph nodes, spleen, and other peripheral lymphoid tissue with immunocompetent T lymphocytes.

     The thymus is a well-developed organ at birth and continues to increase in size until puberty. After puberty, however, it begins to atrophy until in old age it becomes barely recognizable. This atrophy could be driven by increased steroid levels beginning in puberty and decreased growth factor levels in adults. The atrophied thymus is still capable of producing new T cells if the peripheral pool becomes depleted as occurs after the lymphoid irradiation that accompanies bone marrow transplantation.


FIGURE: A schematic drawing of the thymus. Hassall’s corpuscles are collections of epithelial cells that may be involved in the development of certain (regulatory) T cell subsets in the thymus. 


Extramedullary Hematopoiesis


     Hematopoiesis in the bone marrow is called medullary hematopoiesis or intramedullary hematopoiesis.

   Blood cell production in hematopoietic tissue other than bone marrow is called extramedullary hematopoiesis.

   In certain hematologic disorders when hyperplasia of the marrow cannot meet the physiologic blood needs of the tissues, extramedullary hematopoiesis can occur in the hematopoietic organs that were active in the fetus, principally the liver and spleen. Organomegaly frequently accompanies significant hematopoietic activity at these sites. This extramedullary hematopoiesis in postnatal life reflects the ability of inert hematopoietic cells to become active, functional cells if the need arises.


Thursday, November 26, 2015

Sites of Hematopoiesis


   Hematopoiesis/Hemopoiesis is the process by whitch blood cells are formed. 

Sites of Hematopoiesis

Yolk sac

     From the 18th day after fertilization, the yolk sac begins hematopoiesis. The cells made here are erythrocytes & few macrophages.

Aorta-gonads-mesonephros (AGM) region

     Located along the developing aorta. This region has the ability to make a wider range of hematopoietic cells including lymphocytes.

    At about the 3rd month of fetal life, the yolk sac & AGM discontinue their role in hematopoiesis.

Liver

    At about the 3rd month of fetal life, the liver becomes the chief site of blood cell production. The liver continues to produce a high proportion of erythroid cells, but myeloid and lymphoid cells begin to appear in greater numbers.

     As fetal development progresses, hematopoiesis also begins to a lesser degree in the spleen, kidney, thymus, and lymph nodes. Erythroid and myeloid cell production as well as early B cell (lymphocyte) development gradually shifts from these sites to bone marrow during late fetal and neonatal life as the hollow cavities within the bones begin to form.

Bone Marrow

     The bone marrow becomes the primary site of hematopoiesis at about the 6th month of gestation and continues as the primary source of blood production after birth and throughout adult life.

    The thymus becomes the major site of T cell (lymphocyte) production during fetal development and continues to be active throughout the neonatal period and childhood until puberty. 

     Lymph nodes and spleen continue as an important site of late B cell differentiation throughout life.

NOTE 

     Liver & spleen may return to hematopoiesis after birth if necessary in a  process  called extramedullary hematopoiesis (production of blood cells outside the bone marrow).


Tuesday, November 24, 2015

Activated Partial Thromboplastin Time (APTT / aPTT / PTT) Test Procedure


Principle

     Platelet-poor plasma is added to an equal volume of partial thromboplastin reagent and warmed to 37°C for an exact incubation time. Pre-warmed (37°C) calcium chloride reagent (0.025M) is added to this mixture to activate the coagulation cascade. The time required for clot formation is recorded. Clot formation may be detected by optical or electromechanical methods using manual, semi-automated, or automated devices.

Reagents and Equipment
  1. Partial thromboplastin reagent: consists of phospholipids and a contact activator
  2. Calcium chloride reagent, 0.025M
  3. Fibrometer system
    a. Fibrometer
    b. Thermal prep block, 37 + 1°C
    c. Automatic pipet
  4. Coagulation cups, non-wettable surface
  5. Fibro-tips
Quality Control

Quality control materials (normal and abnormal) with established control limits should be run. NCCLS recommends controls be tested at the beginning of each testing day, followed by testing during each subsequent shift or with each batch of assays.

Specimen

Whole blood anticoagulated with 3.2% sodium citrate is the specimen of choice. The specimen should be processed to obtain platelet-poor plasma.

Procedure (Fibrometer Testing)
  1. Pre-warm a sufficient quantity of calcium chloride reagent to 37°C for the number of tests to be performed.
  2. Pipet 0.1 mL patient sample or control sample into labeled coagulation cup using the automatic pipet.
  3. To each sample cup, add 0.1 mL of partial thromboplastin reagent using the automatic pipet. Carefully mix the contents of each cup.
  4. Allow sample-partial thromboplastin reagent mixture to pre-warm to 37°C for 1-2 minutes. No longer than five minutes.
  5. Pipet 0.1 mL pre-warmed calcium chloride reagent into coagulation cup containing sample-partial thromboplastin reagent mixture using the automatic pipet (switch in the "on" position). When the calcium chloride reagent is dispensed the timer will automatically start. Alternatively, the timer may be started by touching the timer plate. Reagent should be forcibly added to ensure mixing of reagent and sample.
  6. The timer will stop when clot formation occurs.
  7. Record time taken for clot formation.
  8. Each sample (patient or control) should be run in duplicate.
Results

The average of the duplicate partial thromboplastin times are recorded to the nearest second.

Reference Interval

Each laboratory should establish its own reference interval following a recommended procedure. The reference interval should be re-established with changes in instrumentation, reagent lot number, or at least once a year.

Comments 

1- Partial thromboplastin reagent consists of phospholipids and a contact activator. Kaolin, celite, silica, and ellagic acid are examples of activators available. Care should be taken in choosing the partial thromboplastin reagent, since reagents vary in their sensitivity or insensitivity to lupus anticoagulant.
2- Each laboratory should determine the optimal incubation time for partial thromboplastin reagent and sample based on its assay procedure. The longer the incubation time, the shorter the partial thromboplastin times due to increased contact activation. Excessive heating (>5 minutes) will result in loss of Factor V and Factor VIII.
3- Precision between duplicate measurements is said to be acceptable if the difference between duplicates is 10% or less of the mean of the duplicates.
4- The APTT has been used to monitor heparin therapy. However, newer methodologies such as Factor Xa inhibition assay are replacing this use of the APTT.
5- The APTT is prolonged in:
  • Inherited single factor deficiencies of factors XI, X, IX, VIII, V, II, and I.
  • Disseminated intravascular coagulation (DIC).
  • Presence of circulating inhibitors like lupus-like anticoagulant.
6- If the patient's hematocrit exceeds 55%, NCCLS recommends adjusting the amount of anticoagulant used in the collection tube to prevent over-anticoagulation of the specimen. This correction formula is:

C = (1.85 x 10-3) X (100 - Hct) X V

Where: C = volume of sodium citrate, V = volume of whole blood drawn, Hct = patient's hematocrit.
  

Note
 
Potential sources of error
  • Associated with specimen inappropriate ratio of anticoagulant to blood 
    failure to correct citrate volume if hematocrit >55%
    clotted, hemolyzed, icteric, or lipemic specimen
    delay in processing or testing
    inappropriate storage
  • Associated with reagents incorrect preparation of reagents
    failure to properly store reagents
    use of reagents beyond reconstituted stability time
    use of reagents beyond expiration date
    contaminated reagents
  • Associated with procedure
    incorrect temperature
    incorrect incubation times
    incorrect volumes of sample, reagents, or both
    improperly functioning instrument


Monday, November 23, 2015

Thrombin Time (TT) Test


     TT has an important role as a screening test because it measures the conversion of fibrinogen to fibrin by adding excess thrombin to undiluted plasma. Because the additional clotting factors previously measured in the PT and APTT have no effect on this test, TT is generally useful for evaluating other parameters affecting the formation of fibrin. There can be interference with the conversion of fibrinogen to fibrin for three major reasons: the presence of hypofibrinogenemia or dysfibrinogenemia, the presence of heparin, and the presence of fibrin degradation products (FDP). In rare cases, autoantibodies against thrombin (e.g., induced by topical thrombin application or the use of fibrin sealants) and myeloma proteins can also interfere with fibrin formation and result in an abnormal TT. The TT is useful in corroborating an abnormal FDP result and can verify that the citrated blood sample was drawn through an indwelling heparinized catheter that was not well flushed. An extremely prolonged TT usually indicates a heparin effect. If the sample is contaminated with heparin, it can be absorbed with Hepzyme. The testing can then be repeated, or the specimen can be redrawn.

     The general reference interval for the TT is 10–16 seconds. TT’s sensitivity can be increased by diluting the thrombin reagent to give a control of 16–18 seconds. The TT in preterm and term infants is longer than the adult reference interval even though the fibrinogen level is within the same normal reference interval, which can be explained by the presence of a distinct fetal fibrinogen molecule with altered function. The TT generally becomes normal within a few days after birth.

Thrombin time procedure
  1. Pre-warm 0.1 mL patient or control plasma.
  2. Add 0.2 mL pre-warmed thrombin reagent and start timing device.
  3. Stop timing device upon formation of a clot.
  • Note: Optimal reaction temperature is 37°C. 
  • Reference interval: 10-16 seconds.

NOTE: Conditions associated with prolonged thrombin time


  • Hypofibrinogenemia
  • Dysfibrinogenemia
  • Paraproteins (e.g., cryoglobulin)
  • Presence of heparin
  • Presence of fibrin degradation products
  • Presence of plasmin